The ultimate guide to AI in radiology provides information on the technology, the industry, the promises and the challenges of the AI radiology field. Currently, we are on the brink of a new era in radiology artificial intelligence. AI has had a strong focus on image analysis for a long time and has been showing promising results. Therefore, there are great expectations around applying AI to radiological images.
Radiology has been around for over a century and has known impactful innovations during that time. The discovery of X-rays by Wilhelm Roentgen in 1895 being the first breakthrough, after which came many more. Positron emission tomography (PET) in the 60s, computed tomography (CT) in the early 70s, and MRI in the late 70s, which on its own includes a long list of different imaging options enabling physicians to measure not only different structures but also function of the body. Anno 2019 radiology has its own department in (almost) every hospital and imaging is a crucial part of most patient exams.1
To brief the modern radiologist we have prepared this ultimate guide to AI in radiology.
Contents
First things first: some basic AI concepts
Before we get started, let's make sure we completely understand each other by defining some concepts used on this web page.
What is an algorithm?
An algorithm is a set of step-by-step instructions which can be followed to accomplish a goal or solve a problem. A cooking recipe can be an algorithm, just like directions to the hospital. Most of the time, however, we refer to computer algorithms. These are pieces of computer code aimed at solving specific problems. You insert data, the computer algorithm performs calculations based on this data, and gives you an output; the solution to the problem. In the context of radiology, an algorithm is usually a piece of computer code that takes a medical image as input and returns an answer to help the radiologist with his/her analysis.
What is (training) data?
To build an algorithm you (almost) always need a dataset, the training data, to get started. This dataset will be a batch of the type of data you want your algorithm to analyze. In radiology, this would be image data. Depending on the type of algorithm used, you may need additional information as well. This may be information on what you see in the image (e.g. a segmentation) or other patient information.
What is a label?
For most algorithms you need a labeled dataset. This means that for every data point in your dataset (in radiology, for every image) you know the ground truth: the label. For example, if you want to build an algorithm that is able to differentiate between malign and benign tumors, the medical images in your dataset need to contain tumors and every image needs to have a label "benign" or "malign". This will help the computer to learn how different tumor types can be recognized on the images.
What is an image feature?
An image feature is a measurable characteristic or a specific property that you can find in each image of the training data. For example, if your input data is a set of x-ray images of the hip, image features may include the shape of the patient's femoral head, but it may also be more abstract such as the distribution of gray-scale values within the femoral head.
What is a feature space?
All features combined can be represented in feature space. A visual representation of feature space (showing features in a graph) can help to get an overview of all feature values. The simplest example is when your dataset has two features. You visualize this by drawing a graph with one feature on the x-axis and the other feature on the y-axis. Each image can be represented in this graph by drawing a point at location (X,Y) with X being the image's value for the first feature and Y the image's value for the second feature. Analyzing data in (the right) feature space makes it easier to discover correlations which are not apparent when looking at the original data.
AI from the start
Artificial intelligence is expected to play a huge role in transforming radiology practice. Therefore, we aim to provide a high-level explanation on the very basics of artificial intelligence. What is it and how does it work?
The buzzwords in perspective
Whenever AI is discussed, words like machine learning, deep learning and big data get thrown around... but who knows his machine learning from his deep learning? Let’s get a clearer picture of some of these buzzwords. How do AI, machine learning and deep learning relate to one another? A schematic overview of the field as a whole is shown in Figure 1 below. Artificial intelligence is a field of science, with machine learning being an important sub-field, and deep learning is a sub-field of machine learning. The distinctive characteristics for each field are discussed in the sections below.2
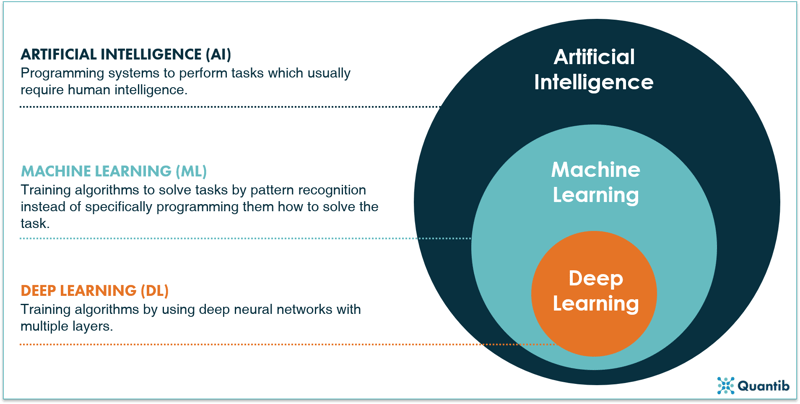
Figure 1: A schematic overview of AI, machine learning and deep learning.2
What is artificial intelligence and how does it work?
Depending on the context, several definitions for artificial intelligence can be used. Many of these definitions link human behavior to the (intended) behavior of a computer. In the case of radiology these definitions do not quite cover the scope of AI as there are many situations where AI exceeds human capabilities. In radiogenomics, for example, we link genetic information to what we see on medical images, enabling us to predict the presence or absence of genetic mutations in a tumor which can be used to determine further diagnosis and management. Another example is applying deep learning (DL) to image reconstruction in MRI or CT, called deep imaging. Image quality can be boosted by using DL algorithms that translate the raw k-space data of an MRI scan into an image. A definition for AI that fits these criteria could be
“a branch of computer science concerning the simulation of intelligent human behavior in computers”.
Refining this definition of AI even further to the context of radiology results in
“a branch of computer science dealing with the acquisition, reconstruction, analysis and/or interpretation of medical images by simulating human intelligent behavior in computers”
There is a wide range of methods within the field of artificial intelligence. As discussed previously, machine learning covers part of this field and deep learning is one of the methods within machine learning (frankly, there are numerous ways to implement deep learning too, but we will come to that later). In this section we will discuss a few methods that are within the realm of AI, but do not belong to ML or DL.
An AI example: Rule-based engines
Rule-based engines are among the most straightforward algorithms. Visually these can be represented by a decision tree. Such an algorithm is an implementation of questions asked by a computer in a specific order to come to a final answer. Not much different from the decision protocol trees used in hospitals to guide processes. The idea and implementation can be fairly straightforward. However, the more detailed your problem, the more questions you need to ask, thus the more complicated your algorithm gets. Additionally, you should take into account that each question needs a “sub-algorithm” that is able to find an answer. For example, if you want to know whether a tumor has sharp edges, you need a “sub-algorithm” that is able to determine what type of edges can be seen in the image.
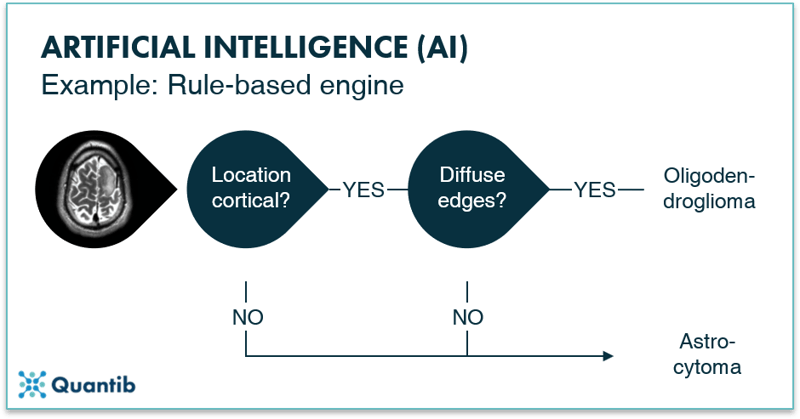
Figure 2: A rule-based engine is an example of an AI method. One can actually compare it to the computer version of a decision tree: the computer goes through a programmed scheme of questions, helping it solving the main problem. In the image above the question is whether the tumor an oligodendroglioma or an astrocytoma?
What is machine learning (ML) and how does it work?
Machine learning algorithms are a subset of artificial intelligence methods, characterized by the fact that you do not have to tell the computer how to solve the problem in advance. Instead, the computer learns to solve tasks by recognizing patterns in the data.
What is the difference between supervised and unsupervised learning?
Machine learning techniques can be divided into supervised and unsupervised algorithms. This categorization has to do with the type of data used to develop the algorithm.
Supervised methods use a dataset that is labeled, meaning a ground truth is available in the database. In the case of medical imaging this can be for example a (manually obtained) segmentation of brain tissue, a yes/no to the question whether the patient has a fracture, or a Kellgren-Lawrence-score for scoring osteoarthritis on X-ray images of the hip.3
Unsupervised methods on the other hand, use a dataset without labels. These algorithms are typically developed by presenting it with a large stack of data in which the algorithm on its own will find correlations between features present in the images, i.e. it will start recognizing patterns. Based on these patterns the algorithm will divide the dataset into separate groups, for example brain scans with metastases and those without.4 An advantage of unsupervised learning is that these methods can find patterns that are hidden to the human eye. For example, an unsupervised trained algorithm might be able to recognize tumors in MRI scans of the brain, which are not yet discernible for radiologists.5
A third option between supervised and unsupervised methods are the semi-supervised methods. This approach uses a smaller set of labeled data combined with a bigger set of unlabeled data. The labeled dataset is used to create the algorithm and guides it in the right direction after which it refines itself using the unlabeled data. This technique can be the go-to method when it is clear what type of outcome you want, but a dataset with good quality labels is hard to get. For example, brain scans with manually segmented white matter hyperintensities are very labor intensive to create and must meet a very high quality standard, hence creating a large labeled dataset to perform fully supervised learning can be a lengthy and therefore expensive process.6 Instead, a semi-supervised strategy can be used with a subset of manually labeled images (e.g. with a segmentation of white matter hyperintensities), which can be combined with a bigger unlabeled dataset.
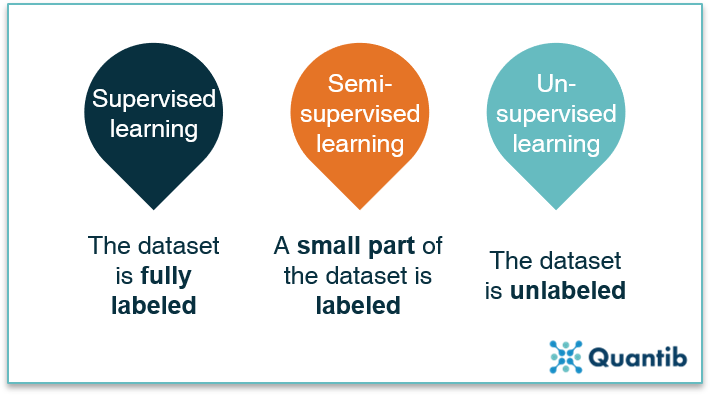
Figure 3: All machine learning methods can be divided into three groups: supervised learning, semi-supervised learning and unsupervised learning, with the data being fully labeled, partly labeled or fully unlabeled.
Another way of categorizing the machine learning space is by looking at what type of goals the algorithms pursue. Does the algorithm classify images or patients into certain categories? Does it predict a continuous value? Or does it group data without having access to labels? The different types of algorithms that meet these descriptions are discussed in the following sections.
What are classification techniques?
Classification algorithms classify the input they get. For example, whether a brain tumor is an oligodendroglioma or an astrocytoma, along with the certainty of this classification. A schematic representation is given in Figure 4. Classification algorithms are typically created using labeled images. Because you know exactly in which classes you want to categorize your input, it is a supervised method.
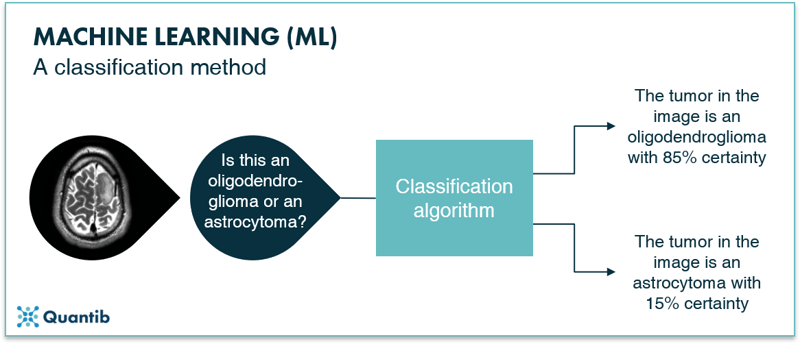
Figure 4: A schematic representation of a classification algorithm. The algorithm classifies the input images into different categories. In this example the oligodendroglioma category or the astrocytoma category.
Example of a classification technique: Support Vector Machine
An example of a basic classification algorithm is a support vector machine, or SVM for short. The idea of an SVM is simple. First, you select specific (image) features on which you want to train the algorithm. These features are, for example, the distribution of gray values in the image, or the presence of certain shapes. Most importantly, these features should be known for all images you use to develop the algorithm. Secondly, this training data is plotted in feature space (Figure 5, left panel). Because an SVM is a classification algorithm, it will attempt to sort the data in multiple classes. In our example, there are two classes depicted as green and dark blue circles. To sort the data, it should be known to which class each data point belongs, i.e. the dataset should be fully labeled. To keep it simple, this figure shows a 2-dimensional feature space, with the value of one feature on the x-axis and the value of the other feature on the y-axis. However, these feature spaces can contain many more dimensions.
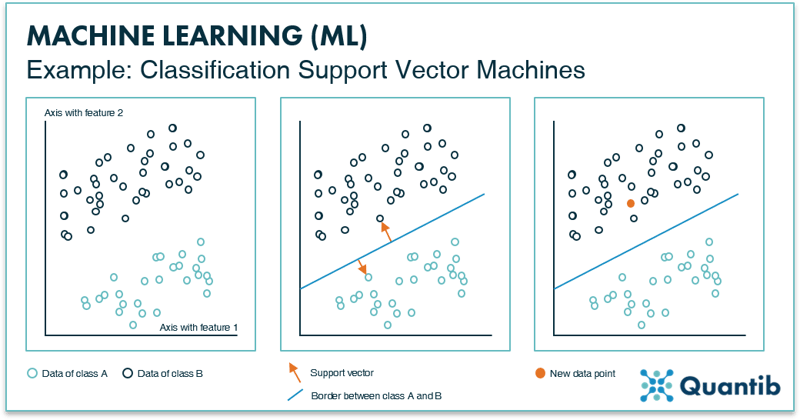
Figure 5: The left inset shows an example of a “feature space” with two data features, resulting in two axes. All data points will be plotted in this space according to their value for feature 1 and feature 2. The middle inset presents how an SVM determines the line that best separates the two data classes. The method is called SVM because of the vectors, arrows (depicted in orange), that are used to calculate the line. The right inset shows that depending on how each new data point is plotted in feature space, it is determined to which class it belongs (i.e. on which side of the border it is).
Thirdly, the algorithm randomly picks a line that separates the two classes in this space. The location of this border is optimized by choosing it to be as far away as possible from the data points of class A, as well as from the data points of class B. In other words, the algorithm aims to maximize the distance between the data points and the line. This is done by selecting the two points (one of each class) that are closest to this random line. The SVM will draw the “support vectors” between the data points and the line, as shown in the middle panel in Figure 5. The last step is to move the line around until the optimal location is found. This is when the length of the support vectors combined is the largest. After it is determined where this border should be, the algorithm is practically done. To classify a new image, it is plotted in feature space to determine on which side of the border it ends up. And there you have it: an algorithm that is able to classify new data points.7
Another classification example: K-Nearest-Neighbors
Another example of a classification method is the K-Nearest-Neighbors (KNN) technique. As is the case with SVMs, the training data is plotted in feature space (Figure 6). However, appointing classes happens based on a specific number (K) of nearest data points. For example, in the leftmost image in Figure 6, for K equals 1, you check which single data point is closest to your test example (the orange point) by drawing a circle (orange circle) that is just large enough such that one extra data point falls within this circle. In this example, we will assign these points to class A. In the middle panel K equals 3, which means the size of the circle in increased such that 3 data points are enclosed. The algorithm then counts how many of these points belong to class A or to class B and assigns the new point to a specific class based on which class the majority of points in the circle belong to. In the middle and right panels this is class B, so the new data point is classified as class B. For the more detail-oriented readers: it is up to the algorithm designer to specify if a simple majority is used for classification or some other cutoff.
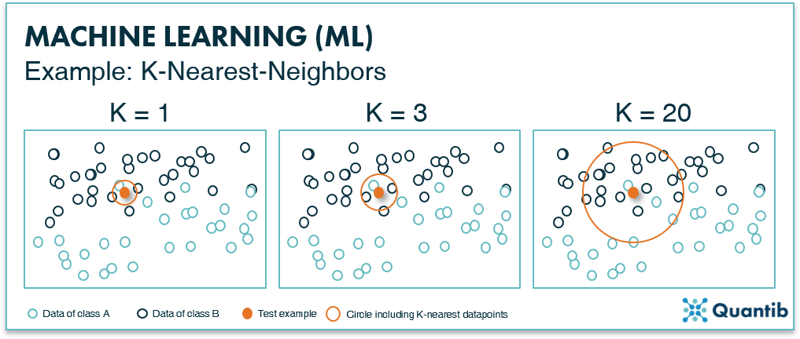
Figure 6: The K-nearest-neighbor method uses the K-nearest data points to classify a new data point. If the majority of these K data points are of a certain class, the new data point will be classified as this particular class.
What are regression techniques?
Another set of commonly used ML methods are regression techniques. Regression methods help to predict a continuous value based on an input, in contrast to a discrete value, e.g. a class, as described in the classification section above. For example, the input could be an MRI scan using BOLD-contrast imaging and the output is the oxygenation level of the tissue. As the algorithm needs to predict a value of a specific variable chosen in advance, the training data should be labeled with this variable, hence regression techniques are supervised training techniques.
A regression example: support vector machines
That sounds familiar! Good, you’ve been paying attention. Next to classification problems, support vector machines (SVM) are also a suitable method to solve regression problems. If you have missed the explanation on the SVM method in classification problems, it is a good idea to go back and read that section first.
The main difference between an SVM for solving classification problems and an SVM for solving regression problems is the end goal. For classification problems, you start with a dataset that consists of data points of two different classes and you want to determine for a new data point whether it is more similar to class A or class B. For regression problems, you start with a dataset that only has one class and you are looking for a correlation between different features of this dataset. An example is the coronary calcium score on CT. The input is an image, the output is a continuous number. This is already applied in many hospitals: regression algorithms at work!8
Building a regression SVM works as follows. First, specific image features are selected with which the algorithm is trained. Importantly, all of these features need to be known for each data point. Secondly, this training data is plotted in feature space. In Figure 7 we again show an example of a two-dimensional feature space, but also for a regression SVM the algorithm can be developed using a feature space of many more dimensions. Analogous to classification SVMs, a line is determined by minimizing the distance of data points to the line. However, this line is not used to classify data points in separate classes. Instead, the line describes the mathematical relationship between a change in one feature and the resulting change in the other feature. In other words, the line is used to predict values (y-values) based on an input from a new subject (x-values). This is where the “support vectors” come into play (middle panel in Figure 7). In this example, two orange support vectors are shown (in reality, every data point will get such a vector). The length of all these vectors is summed and the line is adjusted until the right location is found for it, i.e. when the sum of all vectors lengths reaches a minimum value. The end result is a line that expresses the correlation between feature 1 and feature 2 for this dataset. For a new data point of which you only know feature 1, you can now predict what feature 2 will be. It is important to realize that for higher dimensional feature spaces, this regression “line” can take on complex, non-linear shapes.
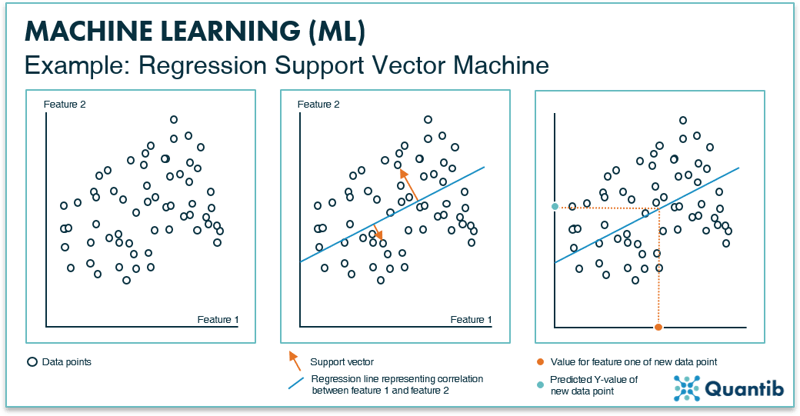
Figure 7: The left inset shows an example of a feature space with two data features, resulting in two axes. All data points are plotted in this space according to their value for feature 1 and feature 2. The middle panel shows the support vectors (depicted in orange) that will help define the line that best represents the correlation between feature 1 and 2 for this dataset. The right inset shows how the regression line is used to predict a value for feature 2, when only a value for feature 1 is known.
What are clustering techniques?
Clustering is quite similar to classification in the sense that these methods group input data into different classes based on predefined features. However, clustering techniques are typically used when no ground-truth labels are available for the different classes. Thus, clustering algorithms define their own grouping system (or “labeling”, if you will) to classify the input data. Hence it should be considered an unsupervised learning method. Let’s find out how clustering techniques work using an example.
A clustering example: K-means clustering
K-means clustering is a basic example of a clustering technique. It is an iterative method, meaning that the process is repeated until an optimal distribution of classes is found. First, all data points are plotted in feature space. Second, all data points are randomly assigned to one of the K clusters and the location of the centroid or geometric center is determined for each cluster. In the second iteration each data point is reassigned to a new cluster based on its nearest centroid. New centroid locations are established based on these new cluster assignments. This process is repeated (or ‘iterated’) until the cluster assignment of the data points does not change anymore.8 At that time, the optimal division of data points into clusters is determined and therefore the optimal location of the centroids is set. See Figure 8 for a visual explanation. Every new data point is then compared to the location of these final centroids and classified.
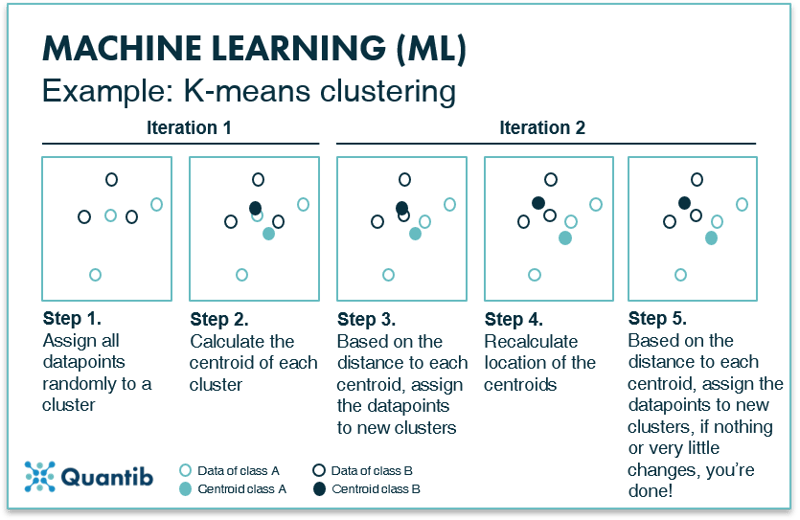
Figure 8: K-means clustering divides a dataset into K smaller datasets based on the optimal centroids for each class.
What about (artificial) neural networks?
Neural networks are also part of the machine learning realm. It is a specific group of methods which solve classification problems, but they are also suited to function as a regression or clustering technique or they can perform segmentation tasks. Neural networks can be used in both supervised and unsupervised algorithms; hence they are a very versatile set of techniques. In the following sections we will explain how simple neural networks work their magic and we will dive into deep neural networks in the next section.
How do neural networks work?
A simple neural network, also called a perceptron, consists of two layers both made up of “nodes” (We will talk more about that in the section What happens in the nodes of a neural network?). Neural networks contain an input layer and an output layer. The input layer receives the image features that are manually derived from the image and performs specific calculations using these features. The output layer receives the outcomes of the calculations from the nodes in the input layer and will give you the outcome to the question the neural network is supposed to answer. When we come to the section on deep learning, we will see that in deep neural networks the input layer actually is the image. With a perceptron, this is not the case though.
An example is shown in Figure 9, where we are looking for an answer to the question “what type of tumor can be seen in the input image?” Before data enters the perceptron, we need to design and derive the image features during pre-processing. The input layer then receives these image features and performs calculations based on these features. The output layer tells you what type of tumor it the network expects to be shown in the input image.
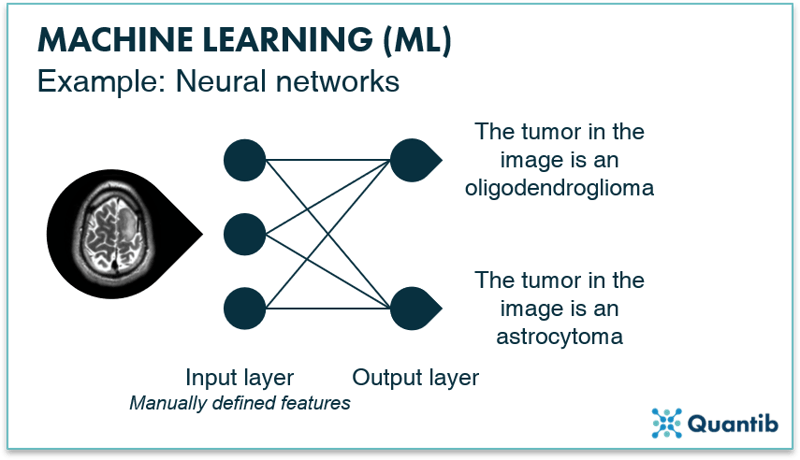
Figure 9: A simple neural network, a perceptron, consists of two layers: an input layer and an output layer. By passing information coming from the input image to the output layer, the algorithm finds an answer to, in this case, the question “What type of tumor is shown in the image?”.
Is a neural network necessarily “deep”? No, it is not. Until now we have discussed simple neural networks. In the next section we will cover deep neural networks.
What is deep learning (DL) and how does it work?
Deep learning is a subset of machine learning with the main differentiating factor being that deep learning uses “deep neural networks”, whereas machine learning comprises a much broader set of techniques. Deep neural networks are similar to the simple network described previously. However, deep networks have hidden layers between the input and the output layer to refine the calculations and hence the predictions. A schematic overview of a deep neural network is given in Figure 10. Simple neural networks require pre-processing to derive the image features which will be the input data for the network, whereas deep neural networks can use the image directly as input.
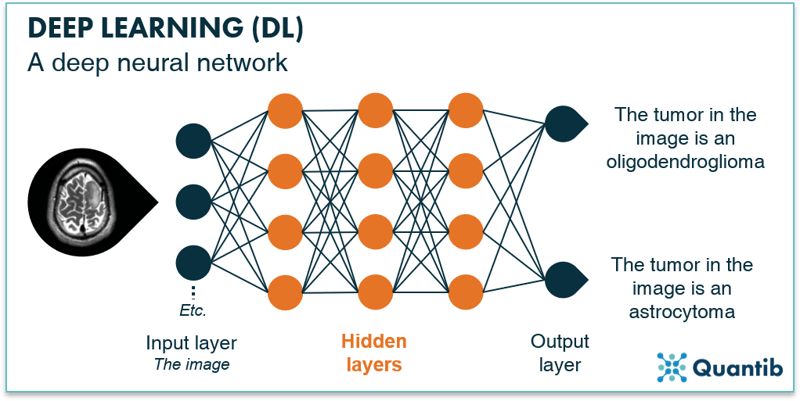
Fig. 10: Deep neural networks is an extension of “regular” neural networks. In contrast to simple or shallow neural networks they use hidden layers before passing the results to the output layer.
What happens in the nodes of a neural network?
In the context of radiology, the input layer would be the medical image (or all the pixels of a medical image). In an ideal world every pixel would be assigned to an individual node. However, due to memory limitations we usually work with sets of pixels that are assigned to an individual node. These nodes then pass the value of the pixel sets on to the first hidden layer. One node in the input layer connects to all the nodes in the hidden layer. This simply means that the value from this first input node is passed on to all nodes in the hidden layer and used there in calculations. This is called a fully connected layer.
The hidden layers are where the magic happens. They receive input from nodes in the previous layer (this can be the input layer or another hidden layer) and perform calculations using this input combined with a set of weights. End result is an output which is passed on from this hidden layer node to the next hidden layer or the output layer.9 The goal of training your neural network is to determine the optimal value for the weights of every node. The higher the accuracy of your algorithm, the better you have determined your weights. See Figure 11 for a schematic overview of this process.
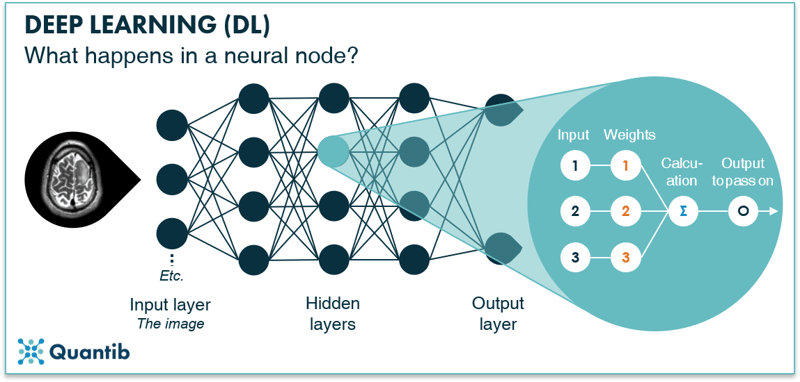
Figure 11: A node in a hidden layer receives input from nodes in the input layer, performs calculations using certain weights and then passes on new values to the next (output) layer.
The output layer receives its inputs from the last hidden layer and combines these inputs into the final answer. The output layer of our example deep neural network in Figure 10 consists of two nodes: the first will return “positive” if the algorithm classifies the tumor as an oligodendroglioma, and the second will return a positive if the algorithm classifies the tumor as an astrocytoma.
How can AI help the radiologist?
Radiologists are extremely busy healthcare professionals. They cannot afford to make any mistakes. They need to interact with a wide range of referring physicians; neurologists, urologists, orthopedic practitioners, the list goes on. They need to be sharp, always. What can AI bring these stretched radiologists and make them even better at what they do?
What are the benefits of AI in radiology?
There are several ways AI can advance the performance of radiologists even further. In this section we will discuss a few of these approaches. This list is not exhaustive. There are many more ways for AI to benefit the radiologist. We will expand this section in the future.
Provide a more differentiated diagnosis
Many AI solutions are focused on providing extra information. This can be by quantifying information enclosed in an image, where it is currently only reported in a qualitative way. Or the software can add normative values, allowing physicians to compare patient results to an average based on a cross-section of the population. The difficulty with this benefit is that we do not always know yet how to handle this extra information. What does a specific value mean? When does a patient differ significantly from the population and what does this mean for the diagnosis? As we have little experience yet with quantified information, there are often no guidelines (yet!) on what this information means or what a radiologist should do with it.
Pick up repetitive routine tasks
AI is not good at everything. At least not yet. What are currently the best tasks to hand over to AI? Tasks for which we have loads of data available, that are fairly straightforward and do not require combining a lot of different input. Hence the simple routine tasks radiologists do a lot. Usually this concerns the more monotonous tasks, in other words the tasks that radiologists find cumbersome.
Offer a second opinion
Having an AI algorithm run in the background offers an easy way for obtaining a second opinion. The algorithm results can serve as a simple backup check on the diagnosis of the physician. An additional benefit of having AI software running as a second opinion is that it allows the radiologist to gradually get used to working with AI and build trust as they see that it adds value. To serve this purpose well it is very important the software performs strongly and does not return a lot of false positives or negatives. Additionally, it is critical to have procedures in place for when the AI software comes up with a different diagnosis than the physician did.
Eliminate inter- and intra-observer variability
Even the best trained, most experienced radiologists might differ in their diagnosis sometimes. Well rested in the morning, something different might catch the attention than after a long working day. Additionally, different radiologists might emphasize different aspects in their reports. This can be tricky for referring physicians, as they need to take into account these variations when synthesizing all the information they have, before coming to a final diagnosis. AI software has the ability to decrease or even eliminate this variability between radiologist reports.
How will artificial intelligence radiology realize these benefits?
There are many tasks AI can perform in the context of radiology. Some tasks will require just a medical image as input and will base the analysis purely on the pixels (or voxels). Others will go one step further and will combine radiological images with information obtained from other sources. What type of analyses should you think of in both these categories?
Using only the image as input
AI that uses only a medical image as input, will deliver results that are mostly similar to what radiologists otherwise would do manually. For example, automatic segmentations of specific organs can be done manually (e.g. liver and HCC segmentation to determine whether a resection can and should be performed). However, these type of analyses are very time consuming and therefore very suited to “outsource” to an algorithm. Another example is the quantification of specific distances (e.g. automatic measurement of RECIST scores). Again this can be done manually, but many radiologists experience this as monotonous task, making it a suitable candidate to get some AI help.
Adding other information from other patient exams
Combining medical images with other information can lead to insights that are not always easily to obtain for radiologists. These types of analyses are usually considered more futuristic. For example, by linking image data to pathology lab results it is possible to let an algorithm derive pathology information from a medical image. Another example is an algorithm that extracts genetic data from images without having access to genetic markups of a patient.
A different type of analysis is adding normative information. For example, by comparing patient organ volumes to the average of the population. This can be useful in dementia research (comparing volumes of specific brain structures to a normative database) or in case of splenic enlargement.
How can AI help the radiologist help patients?
Each diagnostic process aims to realize the best patient outcomes. Medical imaging is increasingly part of the diagnostic chain and should therefore be aimed at the exact same end goal: benefiting the patient. Hence for each AI solution used by radiologists to assess images, we should do the litmus test and ask “At the end of the day, does this software benefit the patient?” Simply put, you can think about patient benefits along two axes: the quality and the efficiency axis. We will discuss both below.
Quality increase for better patient outcomes
AI offers great potential to increase quality of current image readings. For example, by performing analysis that are currently not performed because those are too time consuming for radiologists to execute manually. An example is volumetric measurements of organs, where manual delineation is too demanding time wise, but could improve the accuracy of the diagnosis. Additionally, AI is an important enabler of precision medicine. As more patient data becomes available, we can determine in a more detailed way what information implies certain treatments leading to better patient outcomes. Another step in the process that can improve with some AI influence is patient communication. This is not necessarily directly the field of the radiologist, however, radiologists can deliver easier to understand reports to the referring physician that can facilitate patient conversations.
Efficiency improvement to benefit the patient
Quality of care is extremely important, however, if the diagnosis takes too long, great quality is of no use. Therefore, quality should always be combined with efficiency. AI can help increase efficiency in several ways. It can help speed up the diagnosis process by automating tasks that are time consuming when performed manually. For example, RECIST score measurement can be a good candidate for acceleration by automating the process. Another possibility is to help the radiologist prioritize urgent cases. Which imaging exams should the radiologist assess first? AI can do a first assessment and move cases up the list if necessary.
Will AI take over radiologist jobs?
Simple answer, no, it will not take over radiologist jobs. However, it most certainly will take over some radiologist tasks. It will support radiologists by performing automatic measurements which are currently very time consuming. It will pick up routine tasks which are experienced as cumbersome by a lot of radiologists. Yet, radiologists have a much more differentiated job than these type of tasks alone. Radiologist jobs will change, but they will not disappear.
How to get a grasp of the artificial intelligence (AI) in radiology industry?
There are multiple ways of looking at the industry of artificial intelligence (AI) in radiology. One option is to look at all possible use cases AI can handle. To make sure we cover all possibilities it makes sense to group them according to modality and body site (see Figure 12). Another option is to sketch the complete radiology workflow and draw all possible ways an algorithm can work its magic. This may sound a little vague, but we will explore different ways of grasping the current concepts of AI in radiology in the following sections.
Cover every step in the integrated diagnostic workflow
In this section we will discuss the radiology workflow and look at the steps within the diagnostic chain that algorithms can support. A few examples using the simplified overview of the diagnostic chain are outlined below.
.png?width=800&name=Pillar%20page%20-%20figure%2012-compressed2-min%20(1).png)
Figure 12: A schematic overview of the diagnostic chain, including a few examples of steps where AI algorithms can play a role.
-
Radiology image to radiology report
This is where most companies showcasing, for example, at RSNA are operating. These companies usually develop software as a direct support tool for the radiologist: images go in, reports come out often with quantified results. -
Raw scanner data to radiology image
Applying smart algorithms to raw data directly from the scanner, like MRI k-space, can be done for three reasons. Firstly, it can increase image quality. Secondly, it can enable down sampling of the acquired data, hence decreasing scanner time. Thirdly, it may enable lower dose X-rays or CT scans. This is also referred to as deep imaging. -
Raw scanner data to radiology report
It starts to become really interesting when we start skipping steps in the diagnostic chain. For example, it can be done by omitting the image as we know it and letting an algorithm compose radiology reports based on the raw scanner data directly. This, of course, gets tricky when performing a quick check on the algorithm results: human brains do not do well with k-space representations. But if solid performance is proven, it can support radiologists by taking over mundane and laborious tasks which are currently hindering radiologist's work list. -
Radiology image to pathology report
Another approach pushing healthcare forward would be to derive pathological or genetic information based on images alone. An algorithm should be able to figure out image features characterizing different types of tumors which are not (yet) discernible by radiologists. In the future, this technique may help to prevent invasive biopsies. -
Raw scanner data to health outcome
This is as close as we get to a holy grail in medical imaging: connect raw scanner data directly to the expected health outcome. Imagine scanning a patient and right after the scan being able to postulate what this patient can expect in the future. Of course, besides images, you need to include other information in the training dataset that is needed to develop the algorithm. For example, the possible treatments connected to the outcome as different treatments will most likely cause different outcomes.
Many other steps in the diagnostic chain can be supported by AI algorithms. In the future we will expand this section with examples of research illustrating other steps.
AI radiology use case by use case
Let’s assume we want to cover all possible radiology challenges that can be solved by extracting information from medical images. The “space” we end up with, is what we will call “the industry of AI in radiology”. Visually this will look something like:
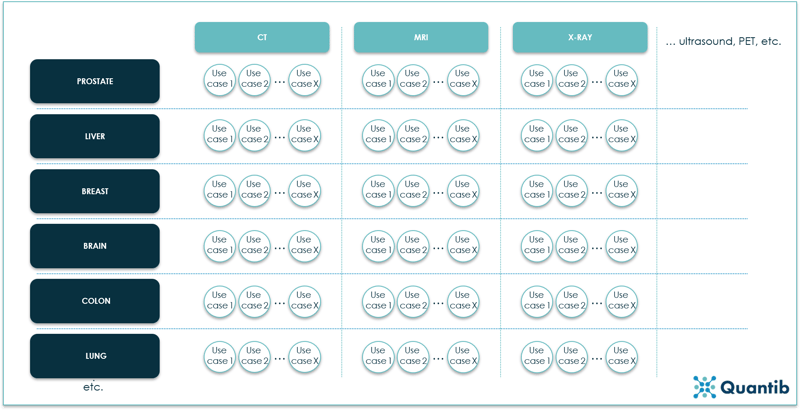
Figure 13: An overview of the AI in radiology industry expressed in modalities, body sites and use cases. Every circle represents one use case, hence a separate algorithm.10
This is quite a reasonable approach. Different imaging modalities have very different characteristics. The result of this being that you cannot simply expect an algorithm that has been developed for brain volume measurements on MRI images to do the exact same analysis using a CT scan. To develop an algorithm that can do both your training dataset needs to comprise of both MRI and CT scans. And you need a lot of those. More than double the amount of data needed for a simple “one modality based” algorithm. The algorithm not only needs to recognize what is brain tissue and what is not, but it also has to figure out whether it is dealing with an MRI or a CT scan. To be able to perform both analysis well, the algorithm needs more data than it would need to answer only one question (i.e. “is this an MRI or a CT scan?” or “what is the brain volume of this patient?”).
Additionally, we need to take different organs into account. Different organs have different shapes, structures and differ in multiple other features, making it very difficult for one algorithm to deal with multiple organs simultaneously. The same problem arises as with the different modalities: combining multiple organs in one algorithm, requires a vast amount of data.
There is yet one level deeper we need to go: different use cases within an organ. Detecting a liver tumor is a very different task for an algorithm than that determining the amount of fat present in the liver. Therefore, most companies out there develop very specific solutions for detecting or calculating a certain value or characteristic in a certain organ on a certain modality.
Do you then need different software for each and every use case? No, not necessarily. You can combine different algorithms in one software package and ask the radiologist to select the use case he or she is dealing with. Another, more automated option is to let the software deduce from the DICOM tags what type of image is to be analyzed to select the algorithm that needs to be applied.
How to implement AI into your daily practice?
When implementing AI software you start with assessing what type of software you need. Once you know what you want, you can start the real implementation process to get the software up and running. How difficult this is strongly depends on the type of software and whether you want to integrate it into other software you already have on site. Therefore, it is important to think about the following questions when choosing AI software.
Cloud service or on-site?
Before talking about integration, it is important to have clarity on the requirements of the hospital on data security. Are patient scans allowed to leave the institute or should they remain on premises? If your hospital is okay with sending anonymized scans to an external party, you might be able to use the integration of a cloud service. Many AI radiology companies offer cloud services requiring you to send the scans, and they do the processing for you offsite. Be aware though that you are depended on their turnaround time, plus usually there is no way to modify the results you get back. You need to include them in your reports as is, at most you can add some comments.
Standalone workstation or floating license?
The most basic on-site solution is a standalone workstation. The AI software gets installed on one computer which can be used by all users. If your hospital has a high workload of specific cases, this could be a good solution. Or if radiographers can use the software for prepossessing. However, most often a floating license solution is preferred. This solution allows physicians to access the software from multiple computers.
Integration with other radiology vendors?
For many hospitals this is the preferred option. And not without reason: it saves a lot of hassle as the integration into the workflow is taken care of by other parties such as the AI software company and the other radiology vendor involved (e.g. a PACS company). The only thing the hospital needs to do is to activate the plug-in in their PACS, voice recognition software, advanced viewing tool or any other already installed piece of radiology software. It is important to double check if there are any other conditions. For example, if the software requires automatic forwarding, is this something you can easily turn on in your PACS?
On the other hand, this scenario is quite challenging for the industry. Realizing integrations can be a time consuming puzzle and no vendor is alike. Meaning that integrating with PACS vendor X is not necessarily a copy-paste job with respect to integrating with PACS vendor Y. In other words, AI companies have a rather lengthy and time-consuming to-do-list when it comes to integration efforts. For an example, read our blog on 5 options for integrating image based ai into your radiology workflow.
An in-between solution is the use of platforms. These broker-like parties gather several algorithms from different AI companies on their platform and offer the whole package to hospitals. Some integrate with other radiology vendors, others just provide a combination of the partner AI companies within one digital environment. The basic idea is that you do not have to deal with different AI companies, but just with one platform company.
Now or later?
An important question: does your radiology department want to adopt AI technology now or later? Of course, you can wait until the teething troubles are over. However, there are concrete benefits in adopting AI technology now. You can be part of the change, influence how AI software gets developed, and make sure it will fit the needs of radiologists the best way possible. You attract new talent, excited to work with AI technology. Additionally, many AI companies are looking for clinical partners. This may be your chance to do some interesting research projects or obtain discounts because you are an early adopter, willing to be the first to try (and sometimes test) new software. And most likely the best reason of all: AI does add value. Either by taking over routine tasks, enabling a more differentiated diagnosis, accelerating the process,11 or increasing diagnostic accuracy. Which, at the end of the day, all will lead to better patient outcomes. AI has every potential to become the greatest asset available to the modern radiologist.
What are current challenges for AI in radiology?
The sky seems to be the limit when it comes to applying AI in radiology. But for now there are still quite some challenges to overcome before AI will be widely applied and fully adopted in the radiology workflow of which we will discuss a few below.
A sufficient amount of quality labelled data
Within the medical field, access to large high-quality labelled datasets for training is not straight forward. Other general databases are extremely powerful because they include a vast amount of images which are accurately labelled. Comparing the typical medical imaging dataset of approximately 1000 images to a non-medical database which can contain up to 100 000 000 pictures, it can only be concluded that the volume available is clearly still several orders of magnitude behind. A way to overcome this problem is using augmentation.
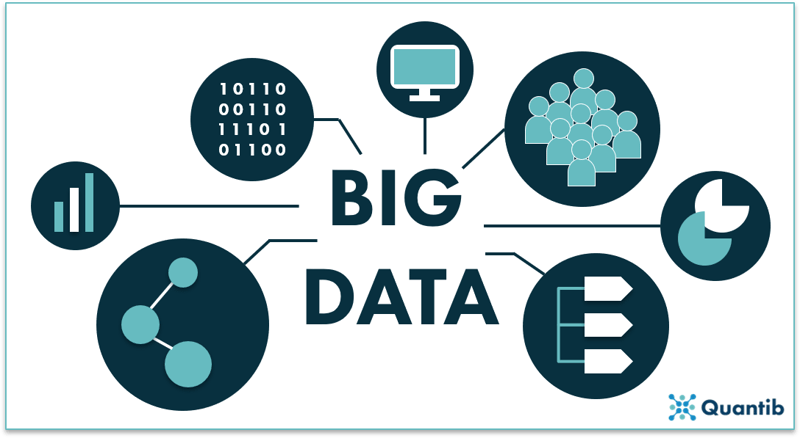
Figure 14: Big data can consist of many different types of data.
Dealing with a 3D reality
The most successful deep learning models are currently trained on simple 2D pictures. CT- and MRI-images are usually 3D, adding an extra dimension to the problem. Conventional X-ray images may be 2D, however, due to their projected character, most of the current deep learning algorithms are not adjusted to these images either. Experience needs to be gained with applying deep learning to these types of images.
Non-standardized image acquisition
Varying scanner types, different acquisition settings… Non-standardized acquisition of medical images creates a challenging situation for the training of artificial intelligence algorithms. The more variety there is in the data, the larger the dataset needs to be to ensure the deep learning network results in a robust algorithm. A method to tackle this barrier is to apply Transfer Learning, which is a pre-processing technique aimed to overcome scanner and acquisition specifics.
A smooth user-experience
One of the most frequent comments radiologists mention are regarding their non satisfactory experience with current radiology software. Why? Because it is generally very user-unfriendly. It requires too much waiting time, too many clicks, and once you are in the program you cannot live without the manual by your side.
Creating a user friendly software is a must for AI companies that want their software to be used in the clinic. However, it is not as straightforward as it sounds. Many applications are developed tech-first, meaning a company starts with an algorithm and then turns it into a product. This is not necessarily a bad approach, you’re certain you’ve got a working algorithm, but testing the user-friendliness of your product should be part of the product development process, preferably from the start, to ensure radiologists will start and keep using it in the clinic.
Figure 15: AI applications should ensure a smooth user experience to encourage adoption.
A business case that adds up
How will the financial picture play out? Will hospitals have to allocate budget? Will the bill eventually be presented to the patient? Or, the scenario we are aiming at, will AI pay for itself? It is unlikely that AI radiology software will, in its current state, be able to fully support itself, mostly due to the upfront investment that needs to be made. In this situation it is only obvious that the investor wants to know what to expect on the long run, hence AI companies need to have a clear view on how their software will financially benefit hospitals in the future: will it save physicians time? Will the hospital be able to shorten waiting times and because of that help more patients? Will diagnosis accuracy improve and cause savings at a later stage in the process? Are there reimbursement codes available for the specific analysis? Answers will vary per use case and per geography, making this an extensive exercise, but to convince the hospitals (and other parties involved), it is of utmost importance for AI companies to have a clear business case.
The right performance metrics
Every scientist will confirm you need to be clear on what you measure, how you measure it and, probably most important, why you measure it. AI in radiology is no different from any other field of research. AI companies need to be very clear on their performance measurements. Often used metrics are accuracy, precision, recall, etc. However, these metrics do not always apply. Accuracy is calculated using the amount of true positives, true negatives, false positives and false negatives. In case of automated segmentation, there is no straight forward interpretation of a true positive or a false negative. Hence metric selection is of utmost importance if you want to paint the right picture on how your software performs.
We will update this section soon with the different types of performance metrics available and the right cases to apply them.
User's trust in radiology AI
However, possibly the most important challenge AI radiology companies are facing is the lack of trust in artificial intelligence when it comes to answering questions related to medical image analysis. AI is often seen as a “black box” of which it is unclear how it exactly came to its answer. How can we ease the adoption of AI and strengthen the user's trust? There are several ways of doing this: with scientific research, installing the software in the hospital and test run the application. Another example, proposed by researchers in 2018, is to let the algorithm show similar cases from the training dataset to give the physicians more information on what data was used to get to a certain insight.12 If AI companies want to survive in the field of radiology, they should invest in gaining the user’s trust.
Bibliography
- 10-Minute History of Radiology: Overview of Monumental Inventions. (2017). Available at: https://www.bicrad.com/blog/2017/6/9/10-minute-history-of-radiology-overview-of-monumental-inventions. (Accessed: 4th March 2019)
- Chartrand, G. et al. Deep Learning : A Primer for Radiologists. RadioGraphics 37, 2113–2131 (2017).
- Hacking, C. & Pai, V. Kellgren and Lawrence system for classification of osteoarthritis of knee. Available at: https://radiopaedia.org/articles/kellgren-and-lawrence-system-for-classification-of-osteoarthritis-of-knee. (Accessed: 4th March 2019)
- Erickson, B. J., Korfiatis, P., Akkus, P. & Kline, T. L. Machine Learning for Medical Imaging. RadioGraphics 37, 505–515 (2017).
- What Is Machine Learning? Available at: https://nl.mathworks.com/discovery/machine-learning.html. (Accessed: 4th March 2019)
- Peikari, M., Salama, S., Nofech-Mozes, S. & Martel, A. L. A Cluster-then-label Semisupervised Learning Approach for Pathology Image Classifcation. Nat. Sci. Reports 8, (2018).
- Pupale, R. Support Vector Machines(SVM) — An Overview. (2018). Available at: https://towardsdatascience.com/https-medium-com-pupalerushikesh-svm-f4b42800e989. (Accessed: 4th March 2019)
- Kaushik, S. An Introduction to Clustering and different methods of clustering. (2016). Available at: https://www.analyticsvidhya.com/blog/2016/11/an-introduction-to-clustering-and-different-methods-of-clustering. (Accessed: 4th March 2019)
- A Beginner’s Guide to Neural Networks and Deep Learning. Available at: https://skymind.ai/wiki/neural-network. (Accessed: 4th March 2019)
- Dreyer, K. Harnessing AI in healthcare. (2017). Available at: http://on-demand.gputechconf.com/gtc/2017/video/s7840-dr-keith-dreyer-harnessing-ai-in-healthcare.mp4. (Accessed: 5th March 2019)
- Ridley, E. L. AI algorithm can triage head CT exams for urgent review. (2018). Available at: https://www.auntminnie.com/index.aspx?sec=sup&sub=aic&pag=dis&ItemID=120662. (Accessed: 6th September 2018)
- Ridley, E. L. New algorithm overcomes imaging AI challenges. (2018). Available at: https://www.auntminnie.com/index.aspx?sec=sup&sub=aic&pag=dis&ItemID=124063. (Accessed: 4th March 2019)


